Paper presented at “Quality Criteria in Survey Research” a WAPOR Thematic Seminar June 27-June 29, 2002, Villa La Collina, Cadenabbia, Lake Como, Italy
Has Methodological Sophistication Been Lost or Gained?
Election
Polling in the 1970s by Sifo, Sweden
Karin Busch Zetterberg and Hans L Zetterberg, ValueScope AB
Contents
A Good Probability Sample with Short Interviewing Period
Deviation from Sampling Plan 1. Excluded from the Survey Population
Deviation from Sampling Plan 2. No response
The effect of No Response on Party Distribution
Problems Encountered with the First Swedish Probability Samples for a Pre-Election Poll
A Culprit: Uncritical Poststratification
Inclusion of Other Variables in Poststratification with Party Choice in Previous Election
Secret and Open Answers, Secret, that is, to the Interviewer
Deviation from Trend. Empirical Margin of Error
Has Sophistication Been Gained or Lost?
Integrity Legislation Restricts Checking
Appendix A. Questionnaire for Sifo´s Political Analysis
Appendix B. Cover Pages to Questionnare
Appendix C. Party Preference Survey from Statistics Sweden
Abstract
This paper describes a system of electoral polling with in-home interviews used in Sweden by the authors in the 1970s. We divided the samples for a continuous survey of party standing in the electorate into a quick-access stratum, and a hard-to-contact stratum. This made it possible to concentrate interviewing to a few days (for example before an election) and still have a probability sample requiring at least four weeks of fieldwork to reduce nonresponse.
While it is good to have a first rate probability sample it is wrong to believe that once you have it you also have a first rate pre-election poll. Deviations in election polls depend also on opinion theory, not only on sampling theory.
Some limits of pure sampling theory are illustrated by poststratifications using information on how respondents voted in the previous election. They greatly reduce the statistical variability in measured voting intentions. They shall not be banned from the pollsters’ tool kit, but their use must be fully guided by opinion theory. The respondents reporting of their past electoral behavior show systematic “memory displacements” caused by the changing political climate of opinion in their circles. We tracked such memory shifts in the voting in the last election and could then perform “critical poststratifications” rather than a standard one from the statistical text books.
Series of regular election polls allow the calculation of trends of party sympathies. We used a sliding mean of nine month in which weights are progressively lower the further away they are from the centred measure. Mean sampling error as conventionally calculated is theoretical standard deviation of results obtained from measurements from numerous repetitions with new random samples. The standard deviation (doubled for the 5%-level) of the difference between a monthly election-poll figures and the trend figures is an empirical equivalent of the statistical margin of error. With results from over 100 subsequent samples of party standing we concluded that the empirical margin is generally much lower that the statistical margin of error calculated by a formula on the basis of only one simple sample. We encouraged our media clients to base their reporting and discussion of a poll’s statistical uncertainty on deviations from trend, rather that deviation from the sample of the previous month.
To record the party preference with maximum realism we placed the questions about parties at a fixed place in the questionnaires – as number two after some questions on the economy. A special experiment conducted 1973 showed that more people answer the questions if the ballot is secret, and that fringe parties both on the left and the right receive a lower share with the open ballot. A panel design was used for the final poll before an election.
Some of the sophistication of this electoral polling system was lost when telephone replaced face-to-face interviews and random digit dialing replaced samples drawn from the population register. Integrity legislation made panel designs with political data virtually impossible. Critical poststratification was forgotten, as was trend analysis. The gains in speed and cost, however, were noticeable. The samples could be larger with smaller budgets. Nevertheless the accuracy of the Sifo polls of the 1970s could not be fully maintained in the following decades.
Has Methodological Sophistication Been Lost or Gained?
Election Polling in the 1970s by Sifo, Sweden
A Good Probability Sample with Short Interviewing Period
The election polls have emerged as a service to political journalism. Their purpose is to give a quick guide to trends of sympathies for parties or candidates as they develop under the influence of ongoing political events. The journalistic interest should be emphasised, since it deviates from the scientific and scholarly. Scholars can wait a year or more until a party trend is established and confirmed by numerous measurements, and sometimes also general elections. Journalists want to know about changes immediately. Election polls seek to satisfy the needs of journalists and their audience by approximating changes as early as possible, what can only later be ascertained more precisely.
This new service had its first crisis of confidence in 1948 in the presidential contest between Dewey and Truman. When asked in 1950 what advice he had to avoid a failure like his 1948 poll Dr George Gallup gave two answers: “Poll to the last day” and “Use probability sampling”.
Sixteen years later we began organizing Sifo's electoral polls in Sweden, Hans Zetterberg as new owner and Chairman and Karin Busch as Scientific Director. After four-five years we had step by step arrived at the methodology described in this paper1. The party standing was reported every month. The poll of party standing, except for the final figures published two days before an election, was part of a regular omnibus survey with in-home interviews. The final methods were summarized and evaluated in Zetterberg & Busch (1976) and Zetterberg (1979). Many passages in the present paper are taken verbatim from the English version ¾ translated by Clare James ¾ of these papers.
[1] Our first attempt to construct a quick probability survey (Zetterberg 1967) was based on the discovery that (in the 1960s) most people in Sweden were at home on Monday nights. Using a Dutch model from NIPO we drew a household sample and interviewed every adult in the household at that time. While the overall non-completion was acceptable by today’s standards, the underrepresentation of young people – particularly young men in the cities – was too bothersome for statistical comfort.
In Gallup’s advice we found a dilemma. We fully accepted that party choice and changes in party choice may occur up to voter’s entry into the polling booth. For example, as early as in the US election of 1944, Lazarsfeld, Berelson & Gaudet (1948) had found in a panel study of a Pennsylvania community that voters under cross-pressures from opposite influences decide late in the campaign, or become abstainers. To stop interviewing a week or two before the election, as Gallup had done in 1948, implied a risk of misleading results.
However, to achieve an adequate response rate, a probability sample, unlike a quota sample, requires a prolonged interviewing period – usually four to six weeks – with repeated efforts to find the hard-to-get respondents. While the final interviews in a typical probability sample may be done very close to Election Day, the bulk of them come from an earlier part of the campaign.
Our first problem, then, was to find a probability sample with several weeks to secure interviews but a few days to interview the chosen respondents. The statistical solution we found for this problem was a separation of the persons to be interviewed into two groups: (1) a quick-access stratum, and (2) a hard-to-contact stratum. The practical solution in a fieldwork with in-home interviews was a separation of the cover with the name of the person to be interviewed from the form with the interview questions. A weekly sample (600 interviews 1970-73 and 500 interviews 1973-79) consists of hard-to-gets + quickly-founds. The samples are additive, for example to a monthly election poll of 1200 to 1000 interviews.
The ID-number of the respondents on the cover is a random number. By choosing for an interview the cover with the lowest available number the interviewer drew a random number and interviewed with the questionnaire of the day (or week in a weekly omnibus). In Appendix B the cover is reproduced.
A cover of a questionnaire was available to the interviewer for four weeks. It contained the name and address of the interviewee and report forms of the efforts to contact him or her. During these four weeks the interviewer could find the phone number of the respondent, book the interview, or make cold visits to those without known phone. The questionnaire for the interview, however, was available to the interviewer only for one week of interviewing before it must be returned to the office. The hard-to-get respondents who could not be interviewed in this period were saved to be interviewed with questionnaires for coming omnibus surveys. They were classified as non-respondents only after four unsuccessful weeks of contact attempts.
Sampling
When Sifo was founded in 1955 major advances of sampling theory and practice for the social sciences had taken place in the United States, documented in works by Cochran (1953), Deming (1950), and Hansen, Hurwitz, & Madow (1953). In Sweden a doctoral thesis on the same topic was under way by Dalenius (1957). He was engaged by Sifo to construct a master selection of localities in which the interviews for national surveys would take place. The administrative divisions of the state church, the parishes, were smallest unit in this self-weighting multi-stage sampling design for in-home interviews. The names of the prospective respondents were drawn from the population registry kept in each province capital. Interviewers were recruited to work in one to three parishes.
Approaching the 1970s the master sample of parishes had to be revised. The principles of the sampling design remained: random at all stages, using the principles of optimal stratification for multi-purpose interviewing. However, the country’s division into parishes had not kept pace with the population development. Some parishes in remote depopulation areas had become small and comprised only a few hundred people, while others in the growing suburban areas had grown into many tens of thousands of people. As a new smallest sampling unit we chose postal codes. This newest division of the country was limited in size so that three small teams of letter carriers could make their appointed rounds in a short period of hours. This size is also an ideal working area for field workers who shall conduct face-to-face interviewing in the homes.
The postal code areas were included in the Swedish population register, but the official population statistics did not report them. It became our task to tabulate the entire population register (8 million records) on postal codes so that their population size and distribution of age, sex, marital status, housing, occupations, and taxable income become known. To this file we added some contextual variables: gross geographical regions, labor market regions, and the rural-urban continuum. On the basis of all this statistics we divided the country into some 50 strata. In these we drew some 400 postal codes. The number of interviews in each was set so that the total sample became self-weighted. The resulting master sample was nicknamed “Miniature Sweden”.
The original postal codes included some parishes from the previous master sample to keep the trained and experienced interviewers in these areas. This we felt was justified since they from the beginning had been randomly selected. The zip codes were replaced with others from the same stratum at the rate of about 15 a year to avoid “exhausting” the population with interviews. We allowed smaller zip codes to be replaced faster than larger ones.
By this time the manually kept Swedish population register decentralized to the capitals of the various provinces had been replace by a computerized nationwide register. This central register served not only government agencies but also the direct marketing industry that ordered lists by zip codes. We could do the same, taking care to replace the sequence number within each zip code with a random number to serve our system of probability sampling with short interviewing periods described above.The Sifo sampling of the 1970s was designed to be statistically correct but it also turned out to be cost-effective.
Deviation from Sampling Plan 1. Excluded from the Survey Population
As we have seen, the names and addresses of the interviewees selected are chosen at random from the population register. The deceased; persons who have emigrated or spend a long period abroad or at sea, are inmates of institutions (prisons, mental hospitals, etc), senile, deaf-mute or severely ill; persons who have moved outside the interview catchments area or to an unknown address; soldiers on manoeuvres; and also persons who are unable to speak Swedish reasonably well are excluded from the survey population. It is not correct or possible for Sifo’s staff to interview these people. Many of those who are excluded from the survey population are entitled to vote. The survey population does not include all those who are eligible to vote, but only voters who are, basically, to be interviewed. The proportion of the total number of names leaving the population in the 1970s was:
|
1972 |
14.2% |
|
1973 |
14.8% |
|
1974 |
15.9% |
|
1975 |
14.3% |
|
1976 |
12.7% |
|
1977 |
10.6% |
|
1978 |
10.5% |
Source: Zetterberg (1979) p 3.
The downturn from 1976 is due to the fact that the upper age limit for the sample was reduced from 75 to 70 years.
Deviation from Sampling Plan 2. No response
Nonresponse includes persons who refuse to be interviewed or whom the interviewers were unable to contact; those who had no time for an interview on the dates the interviewer was able to offer; those who broke the interview agreements; and those who were not interviewed for other reasons. Thus, nonresponse constitutes all the people whom Sifo’s staff, in principle, should have been able to interview but were not interviewed. We have recorded the following nonresponse rates in the 1970s:
|
1972 |
18.7% |
|
1973 |
18.8% |
|
1974 |
19.4% |
|
1975 |
20.2% |
|
1976 |
21.0% |
|
1977 |
21.4% |
|
1978 |
20.8% |
Source: Zetterberg (1979) p 4.
Eight-tenths of the nonresponse consists of people who refuse to be interviewed. We must respect their integrity.
The effect of No Response on Party Distribution
Many have asked about the effects of nonresponse on the parties’ positions in the election poll. Our conclusion from regression analyses and variance analyses is that such effects cannot be proven for any of the Swedish parties in the 1970s.
In the equation
Party share = P*(nonresponse) + Q*(date) + constant
P is always close to zero and never anywhere near statistical significance. The same applies, moreover, if we calculate changes in party shares and its deviation from trend.
No party appears to be a systematic winner or loser from higher or lower nonresponse within the range in which election-poll nonresponse varies. However, we do not wish to rule out the possibility of particular political events making a specific party’s electors more or less inclined to take part in an opinion poll.
Problems Encountered with the First Swedish Probability Samples for a Pre-Election Poll
It is wrong to believe that once you have a first rate probability sample you also have a first rate pre-election poll.
For one thing, a probability sample finds all sorts of respondents such as the shy, the socially incompetent, the week and sickly, the alcoholics and other down and outs. Many of these do not go to the polls on Election Day. Unless the researcher has a very good turnout scale he records party preferences of a large number of non-voters. In a quota sample fewer such people are included.
More important, no sample can correct for deviations produced by the processes of opinion formation. This is a lesson the Swedes might have learned from a poll by Statistics Sweden (SCB) in 1956. This government bureau of statistics had been the first to develop a self-weighting multi-stage sampling design of the kind Dalenius constructed for Sifo. It was tested with a voting question prior to the national election 1956.
|
|
SCB poll Aug-Sept 1956, |
Election Sepember 15, 1956, % |
|
Conservatives |
14.8 |
17.1 |
|
Liberals |
25.9 |
23.8 |
|
Agrarians |
8.9 |
9.4 |
|
Social Democrats |
48.9 |
44.6 |
|
Communists |
1.5 |
5.0 |
|
Others |
– |
0.1 |
|
Deviation: Average |
2.54 |
|
Source: Busch & Zetterberg (1982) p 3.
The causes of the deviations in 1956 are not incomprehensible to common sense
· It is understandable that Communists hesitate to tell their allegiance to their party to government interviewers when the public distrusts Communists to the extent that 61 per cent say that they should not be allowed to be school teachers (Gallup in April 1948 as quoted in Håstad et al (1950, p 248)
· And it is understandable that some Communists and non-socialists profess to be Social Democrats to the interviewers when this party rides on a wave of approval for having lead the country out of the Great Depression in the 30s, kept it out of World War II in the 40s, and still governs in the 50s when the riches of the country only grows and grows.
However, the statisticians did not see it in this way. In the main the statisticians interpreted the deviations as sampling errors. (SCB at that time had no sociologists or social psychologists on its staff.) To adjust the sample they included a question on the voting in the previous election. In the first round they simply multiplied the recorded share of a party in the interviews with the ratio of its actual to reported vote in the previous election. This “ratio method” produced better results in the election of 1958.
|
|
SCB poll Aug-Sept 1958, |
Election Sepember 15, 1958, % |
|
Conservatives |
19.5 |
18.3 |
|
Liberals |
18.2 |
22.5 |
|
Agrarians |
12.7 |
10.6 |
|
Social Democrats |
46.2 |
44.2 |
|
Communists |
3.4 |
4.4 |
|
Others |
|
|
|
Deviation: Average |
2.12 |
|
Source: Busch & Zetterberg (1982) p 3.
Now the large deviations for the Communists and for the ruling Social Democrats had disappeared.
The next development at was more sophisticated than the ratio method. With computers it had become easy to give individual weights to respondents in tabulating their party choice, weights that served to adjust actual samples to ideal ones and weights that tell the likely participation in an election.
Poststratification
In electoral forecasts and public-opinion polls, interviews can be weighted –– i.e. retroactively stratified –– according to figures on how the respondents voted in previous elections, to make the sample congruent with the voting outcome of this election. This method is known as “poststratification.” To permit poststratification, an electoral survey contains not only the question “What party do you think is the best today?” (or the equivalent) but also “Which party did you vote for in the last parliamentary election?” The latter is posed to respondents who were entitled to vote in the previous election
One advantage of poststratification by party in the last election is that it yields stable time series of changes in party sympathies, even with fairly small samples of interviewees. The high correlation that exists between individuals’ party preferences at various times is used to reduce sampling errors. With the close correspondence that, in Sweden, usually prevails between voting for a party in general elections and preference for the party one, two or three years after the election, poststratification permits an appreciable reduction in margins of uncertainty. One formula (Kish 1967 p. 90) indicates that the margin of uncertainty for a sample of 1,000 voters is reduced to roughly two-thirds of its size in a sample of every nth individual. (See also Kish 1967 p. 92, last paragraph of section 3.4C) Post-stratification of other variables –– life cycle, income and social class, for example –– yields much smaller gains. It is not only tempting but reasonable to try to make use of such a large reduction of sampling error.
Poststratification is a statistically unassailable method. Organizations dominated by statisticians use it without hesitation, for example Statistics Sweden (SCB) in their party standing polls financed by the Swedish government. Nevertheless, the polling of party sympathies is a subject that belongs to political science and political sociology; and the statistical methods used in polling must be assessed on the basis of these disciplines. For example, the deviations in the SCB election poll of 1956 could be read, not as sampling errors, but as predictable responses according to public opinion theory.
By the propositions of present-day (2002) opinion theory poststratification is not unexceptionable. And why should anyone experienced in any social science venture to rest an adjustment of party-sympathy figures on the assumption that voters give an entirely correct account of their voting one, two, three or four years ago? Don’t we know that people’s way of describing their past is affected by their current attitude and situation?
At that time, however, opinion theory was in its infancy. The notions that we preferred to express socially desirable opinions could be illustrated but had not reached a systematic formulation (Bradburn & Sudman et al. 1979). A year after the SCB poll Zetterberg (1957) wrote an axiomatically organized theory to the effect that we tend to express those opinions that were common in our circles, and made us liked by others, and enhanced our self-image. Abelson (1959) formulated the state of knowledge about attitude and opinion change in a concise book called Persuation. But it was not until much later when the first German edition of The Spiral of Science (Noelle-Neumann 1980) appeared that the theory of opinion formation reached a level of maturity that could comfortably account for deviations of the kind found in the SCB poll of 1956.
The Shock of 1968
The year 1968 is remembered as the zenith of powerful student protests in the Western countries and a swing to the left, particularly among the younger generations, in the body politic. To the pollsters in Sweden it was a shock of a different kind. The pre-elections polls had been appallingly bad.
|
|
Election % |
SCB (a) % |
Sifo August % |
Sifo September(a) % |
|
Moderate Party |
13.9 |
10.8 |
15.1 |
13.5 |
|
Liberal Party |
15.0 |
13.8 |
17.8 |
17.0 |
|
Center Party |
16.1 |
17.5 |
15.4 |
16.5 |
|
Social Democratic Party (s) |
50.1 |
54.4 |
44.6 |
46.0 |
|
Left Party Communists |
3.0 |
1.5 |
5.2 |
5.1 |
|
Others |
1.5 |
- |
1.9 |
1.9 |
|
Deviation: Average Largest |
|
2.30 4.3 (s) |
2.68 5.5 (s) |
1.80 4.1 (s) |
(a) = published after the election
Source: Busch & Zetterberg (1982) p 4.
The large deviations lead both SCB and Sifo to a period of intense methodological work to improve the methods of surveys about party sympathies. In a series of publications Staffan Sollander of SCB developed the statistical assumptions to imitate the party distribution in hypothetical elections each May and November between the actual elections. (Appendix C). At the time of subsequent elections SCB also conducted methodological studies that are not published before the election.
At Sifo we developed the methods reported in this paper.
A Culprit: Uncritical Poststratification
In the 1966 municipal election, participation was low, especially among Social Democrats who ruled in the national government. A major election issue was the housing shortage. The Prime Minister, Tage Erlander, had handled it so poorly that he became a laughing stock among people looking for apartments. The turnout in the election was low by Swedish standards. Many abstainers were Social Democrats.
In the campaign of the national election 1968, Tage Erlander had regained his status. He had announced his forthcoming retirement and was honoured in his last election, not only as der Alte of Swedish politics, but as the longest serving Prime Minister, a true father of the country and its welfare system. The Soviet coup in the Prague dominated the news, and lead to a national sentiment of ‘united we stand’ for freedom and democracy.
In this climate of opinion many of the stay-at-home voters from 1966 told the pollsters that they had voted in 1966. However, the Social Democrats among them were not counted as increased support for their party in the 1968 pre-election polls. In the uncritical poststratification then used by Sifo, the Social Democracy was weighted down by the low share of SDP votes in 1966. Sifo therefore underestimated the SDP upturn between 1966 and 1968. The following table shows the poststratified and non-poststratified figures for the SDP during the 1967–68 election year.
|
Social Democrats |
Uncritically poststratified figures |
Non-poststratified figures |
|
1967 |
|
|
|
October |
41.5 |
39.8 |
|
November |
42.0 |
38.8 |
|
December |
42.5 |
41.9 |
|
1968 |
|
|
|
January |
42.5 |
42.8 |
|
February |
43.0 |
43.4 |
|
March |
43.0 |
42.0 |
|
April |
42.5 |
40.9 |
|
May |
45.0 |
45.4 |
|
June |
44.0 |
46.8 |
|
August |
47.5 |
49.3 |
|
September |
46.0 |
50.6 |
|
(Election results) |
(50.1) |
(50.1) |
Source: Zetterberg & Busch (1976) p 4.
There is surely no serious doubt that the non-poststratified series in this case is the most reasonable: at any rate, it approaches the election result more closely.
In Gallup International we interviewed the most respected practitioners in the first generation of pollsters about the procedure. Incidences of memory shifts concerning previous voting had made all of them skeptical about uncritical, mechanical and routine poststratification by party in the last election. We summarized the results as follows:
In the U.S., Dr George Gallup calls the method “very tricky.” In the U.K., Dr Henry Durant rejects it entirely for election forecasts on the basis of experience with the British elections of the 1950s and ’60s. In his electoral survey in Norway Mr. Björn Balstad has developed a method of using information on previous voting only if there are minor disparities between the previous election results and how the voters subsequently state that they have voted. If this difference is large, Balstad relies on the unweighted figures. Professor Jean Stoetzel in France thinks that the truth about the distribution of party sympathies, in the long run, lies somewhere between unweighted figures and figures poststratified according to previous vote. The proportion depends on the mode of the public during the election campaign and must, in his view, be estimated separately by political experts. The experts then assess whether there is any reason to believe that a party’s sympathizers are more ashamed of their previous electoral behavior than others, or are drawn so strongly to a new party that they also wish to maintain that they voted for it previously. (Zetterberg & Busch 1976, p 3.)
We wished we had made these interviews prior to 1968.
Perspectives on Memory Shifts
None of us admit with particular pleasure and willingness that we have changed our opinion. It is more attractive to see ourselves as someone who, basically, has always been as sensible we are today. Opinion pollsters do encounter this phenomenon also outside election research. By year-end 1972 practically 100 percent of Swedes thought the U.S. should withdraw from Vietnam. Almost everyone said they had always held this opinion. In actual fact, only two-thirds had thought so two years before.
Historians are well aware of such memory shifts. In their criticism of sources, they never take an assessment of a controversial event written down years afterwards as an acceptable eyewitness report. Instead, they merely regard such an assessment as a sign that the event was perceived or evaluated in a particular way by the informant, or in the informant’s circles, on the day that assessment was made.
For nearly 100 years, analytical psychologists have known and studied various shifts and identified the “defence mechanisms” that underlie them. In recent years, various attitude theories –– “theories of balance,” as they are termed –– have yielded the formulation of laws or equations in a special kind of mathematics for the subject. The problem of “biographical consonance,” i.e. our propensity to –– consciously or unconsciously –– alter data about ourselves to give them a slightly better fit with our current views, is a case in point for these theories.
What form, then, can critical use of information about party voting in the previous election take? Several methods have been tried by Sifo. The most rewarding have been found to be the following:
· Controlling the respondents’ electoral participation in the official voter register.
· Conducting repeat interviews from periods without memory shift.
· Investigating the trend of memory shift concerning party voting in the last election.
Checking the Voter Register
In Sweden the voting register is a public document, not only prior to the election but also after the election with the checkmarks of the enfranchised voters who actually came to the polls. The latter is not computerized but a manually kept record available to party workers, and anyone interested.
A survey researcher may also check whether his selected respondents have participated in previous elections. In the 1970s Sifo performed checks of this kind for three elections. One essential result from these is that between a third and half of stay-at-home voters are non-respondents in surveys involving home visits. Dropouts in surveys and stay-at-home voters are thus recruited, to some extent, from the same categories. If poststratification of previous electoral behavior is to be carried out, the category of stay-at-home voters in previous elections according to these checks should be represented by 56 percent of the number included in the official election figures.
In addition, the checking in the voter register yields, as a by-product, a validation of “turnout scales”, i.e. the questions used to assess the likelihood that respondents go to the polls. This scale comprises interview questions, the answers to which can be compiled to predict electoral participation.
Panel Design for Final Poll
In the 1968 election, the Social Democrats achieved their best result of all time –– an absolute majority (50.1 percent of the votes) –– and thereby consolidated their position as the party of government, as they had already been for 36 years. Some non-socialists and communists were then embarrassed or afraid to admit that they themselves were or had formerly been anything but Social Democrats. The proportions who told Sifo’s interviewers that they had voted for the SDP in September 1968 were as follows:
|
Fourth quarter of 1968 |
50.6% |
|
First half of 1969 |
52.6% |
|
Second half of 1969 |
55.1% |
|
First half of 1970 |
56.3% |
Source: Zetterberg & Busch (1976) p 5.
This distribution confirmed and reinforced Sifo’s scepticism regarding any uncritical use of information about previous electoral behavior. A growing share –– amounting, finally, to some 6 percent –– had undergone a “memory shift”.
In the poll before the 1970 election, Sifo selected its sample from the interviewees of autumn 1968. This sample was then stratified in terms of the data on electoral behavior that were collected in autumn 1968. Accordingly, we were able to utilize party-support data from the 1968 election without any risk of a major memory shift.
The result was highly satisfactory: in its poll immediately before the election, Sifo obtained the figure of 45.5 percent for the Social Democrats, against an outcome of 45.3 percent in the election. SCB, which uncritically used the data on party support in the previous election, gave the Social Democrats 49.2 percent.
Tracking Memory Trends
One crucial advantage of monthly opinion polls is that trends can be ascertained and analysed. The actual purpose of Sifo’s electoral survey is to describe trends of party sympathies, as measured by the question “Which party do you think is the best today?”
The question “Which party did you vote for in the last parliamentary election?” should display no trend if no memory shift takes place. Through trend analysis of this question, we can survey the actual extent of the memory shift and take it into account in a poststratification.
We establish the trend as a centred, sliding mean. For the period between the elections of 1973 and 1976, the trends of memory shifts were as shown by the graph below.
Source: Zetterberg & Busch (1976) p 9.
This graph was drawn using the X-11 computer program (Table D12) from the Bureau of Labor Statistics in The dotted line represents the 1973 election outcome and the unbroken line the respondents’ replies to the question of how they voted in 1973, in the election conducted at the time of the evenly balanced Parliament.
The perception of the previous election differs from the reality of the election. The Liberal Party, which showed the greatest rise according to the poll, also produces higher proportions of voters who state that they supported the party back in 1973. The Center Party appears to be slightly demoralized in the election periods. For the Social Democrats, support in the election is overestimated –– a common situation during the latter half of their long period in power. For the Left Party Communists (LPC), there is an equally consistent underestimation. We see that, in large measure, the overestimation of the Social Democratic voters’ share corresponds to the underestimation of LPC voters.
One solution to the problem of poststratification in electoral polls is now, in principle, clear. Instead of uncritically poststratifying a given outcome of the previous election, the solution is to perform a critical poststratification that uses, as input data, the trend values for the patterns of electoral behavior instead of the election outcome.
Despite the elegance of this solution, Sifo was unwilling to swallow this method hook, line, and sinker. There are three reasons for this. The trend figures for a given month cannot be established with complete accuracy until we have an additional few months’ measurements. At that point in time, we have only an approximation of the trend. Our experience in econometrics, with Henderson-type graphs, shows that the final figures obtained in the series are easily overdramatized, and that these figures should therefore be treated with great caution. Using final figures as the basis for poststratification would sometimes involve inserting, rather than reducing, errors. The other reason is that political realism calls for responsiveness to sudden changes in political climate, and not only slow changes indicated by gentle trends. A political scandal, major betrayal of the voters’ confidence or sudden crisis can change perceptions of electoral behavior more rapidly than our trend graph can register. Thirdly, the method does not do justice to the underreporting of communist votes. This bias in reporting of LPC voting has a systematic component that appears to be entirely independent of variations in the political climate. Nor is it correlated with the size of the nonresponse rate. During the 1970s, the average dropout rate underreporting in Sifo’s polls of LPC was 1.4 percent.
Trend computations of memory shift are, however, valuable in other ways. On the one hand, they provide indications of the mood in each party. On the other, they have given Sifo a clear rule that indicates when it is reasonable to perform poststratification based on party support in a previous election:
Only if the memory-shift trend does not deviate substantially from the election result for a parliamentary party can conventional (uncritical) poststratification be used. We count as a substantial deviation 2 percent for parties supported by more than 20 percent of voters, and 1.5 percent for the other parliamentary parties. By following this rule, we ensure that poststratification does not perpetuate an election outcome in the figures of the electoral survey.
During the election period 1973–76, ordinary poststratification was acceptable according to this rule the whole time, except for a couple of months in spring 1974 when the Social Democrats’ perception of the previous election deviated more than 2 percent from reality and a couple of months in spring 1976 when the same thing happened and the Left Party Communists also showed a substantial deviation.
What, then, shall we do if the memory-shift trend deviates substantially from the election outcome? We set up a graduated procedure, as follows.
If the memory-shift trend deviates more than one and a half times the above-mentioned margins, poststratification by party support in the previous election is not usable. We can then apply poststratification solely to variables other than party support in the previous election, such as the respondents’ age, sex and home region. This involves a higher margin of uncertainty in the electoral poll. Should this situation arise, the poll's readers will of course be informed.
Regarding the trend of between one and one and a half time the margins specified above, we give the mean of two figures: one poststratified by party and one not poststratified by party. We thus include only part of the stabilizing effect of the poststratification, so as not to risk incurring its whole distorting effect. This eventually become our standard rule, regardless of the size of the deviation.
These and the other decision rules for the calculation of Sifo’s electoral polling from the 1970s are exhaustive. They leave no scope whatsoever for assessments influenced by the personal opinions of the researchers and their staff who carry out the work. Nor can they be influenced by political experts in the media and the climate of opinion. This is essential particularly in the hectic excitement of the election week which may easily tempt last minute massaging of the data.
Inclusion of Other Variables in Poststratification with Party Choice in Previous Election
When Sifo in the 1970s carried out poststratification according to party support in the previous election, poststratification by age and sex was simultaneously derived. Age is taken from the population register; thus, no memory shift can arise here.
Regional election results can be derived from the election statistics, thus affording a key for poststratification in terms of both electoral behavior and region. If, on the other hand, the aim is to obtain the weighting targets for poststratification by past voting, age and sex, no official figures are available since voting secrecy does not permit election results to be distributed according to age and sex.
Several iterative methods, available in the form of computer programs, can produce a table of the survey population usable for poststratification that include other variables as well as party choice in the previous election. Such a table is, of course, never entirely exact. The structure with the parties of the 1970s is shown below.
|
Demographic Variables (cross tabulated) e.g. age, sex, marital status (combined into life cycle stages) occupation, income or other stratification level |
Party Chosen in the Last Election |
Stay at home |
Non fran-chised |
Weight Goals from Population Statistics |
||||||
|
Mod-erate Party |
Liberal |
Center Party |
Social Demo-crats |
Com-mun-ists |
||||||
|
|
|
|
x |
x |
x |
x |
x |
x |
x |
Y |
|
|
|
|
x |
x |
x |
x |
x |
x |
x |
Y |
|
|
|
|
x |
x |
x |
x |
x |
x |
x |
Y |
|
|
|
|
x |
x |
x |
x |
x |
x |
x |
Y |
|
|
|
|
x |
x |
x |
x |
x |
x |
x |
Y |
|
|
|
|
x |
x |
x |
x |
x |
x |
x |
Y |
|
|
|
|
x |
x |
x |
x |
x |
x |
x |
Y |
|
Weight Goals from Election Statistics à |
Z |
Z |
Z |
Z |
Z |
Z |
Z |
Total Survey Population |
||
The cross tabulation inside the table (labelled x) are approximations from large sample survey(s), while the figures in the margin (marked Y and Z) are exact numbers of the population according to official sources. An iterative process revises the figures inside (x) with the minimal disruption of their intercellular correlations, bringing them into line with the correct margins (Y and Z). The result is a matrix usable for poststratification.
Our experience is that one should keep these grids small (48 or 64 cells); larger grids may introduce more errors than they eliminate. It is also advisable to enter a maximum allowable weight, for example, 3.0 so that the answers from no interview are counted as more than three times in the tabulations of a poststratified survey. You may also enter the minimum acceptable weight, for example 0.33, so that an interview will count at least for a third of an individual in any tabulation.
Since 1967 Sifo has had a computer program, MITER by Ed Ross, for this operation. ECTA, the well-known analysis program from Bell Laboratories, also has an option for proportional iterative adjustments usable for the creation of a matrix for poststratification.
Popping the Questions
A difficulty of voting preference inquiries between elections is the absence of an election campaign. Most pollsters ask: “If the election was held today, which party would you vote for?” But the problem during most weeks of the year is that there is no election today and there has not been any election campaign. An easier question is “What party do you think is best today?” For with or without an election most everybody has a preferred party.
Recording Party Preference
In the home of the respondents Sifo’s interviewers began the interview by first asking some standard questions about consumer confidence. Then they arranged a realistic voting situation. The consumer confidence items dealt with the country’ economy, their own economy, income expectation, and purchase plans. These questions were placed ahead of the voting questions. We thought that they might bring forth a mind set reminiscent of an modern election campaign focused on the economy.
The political questions and the procedures during the voting situation were the following: (Details are found in Appendix A..)
TO
SWEDISH CITIZENS OF VOTING AGE: You will now take part in something similar to
an election for parliament and leave your vote in this envelope. SHOW BROWN
ENVELOPE. Do not tell me how you vote or which party you favor. Only put your
ballot in the envelope. Everything is totally anonymous. I will never know how
you voted. Only personnel at the Sifo´s head office may open the envelope and
find out how you voted.
Here are eight cards with the names of the political parties. Please choose the
party you like the best today. HAND OVER BALLOTS TO RESPONDENT..
Here is an envelope. HAND RESPONDENT THE BLANK ENVELOPE!
Please put your ballot into this envelope and keep the rest so that I cannot
figure out how you answered. Do not tell me how you plan to vote. Please, seal
the envelope and put it into the larger envelope. PERSONS WHO SAY THAT THEY
CANNOT OR DO NOT WANT TO ANSWER THE QUESTION ON BEST PARTY MAY LEAVE AN EMPTY
ENVELOPE.
In the pre-election poll of 1970, Sifo asked interviewees to report their party support by means of a ballot paper placed in a box. Accordingly, the interviewers never found out how the interviewee was actually going to vote. This contributed to the good results mentioned .
By a similar procedure the respondents who were eligible to vote in previous election repeated their voting in the interview.
TO ALL SWEDISH CITIZENS BORN 19XX OR EARLIER: Now I would like you to think back on the latest election for parliament, which took place in 19YY. Please repeat and vote exactly as you did then. Please use these ballots and this envelope. HAND OVER BALLOTS AND ENVELOPE MARKED “ELECTION 19YY”.Do not tell me how you voted. Only put your ballot in this envelope. If you did not have the opportunity to vote in 19YY, you can use the ballot with the text “I did not vote in the parliamentary election in 19YY” and put it in the envelope instead. Do not tell me if you voted or not.
The response to this question provided the basis for poststratification and for tables showing the flows of voters between the parties since the election.
Recording Views on Turnout
The calculation of turnout in an election is often more difficult that the calculation of shares received by parties or candidates. The Swedish pollsters have here a comparatively easy task since voting participation in their country is very high; in the national elections of the 1970s it ranged between 88.3 per cent and 91.8 per cent of the eligible voters. Our best aid in forecasting an accurate number is a correct poststratification by stay-at-home voters, as we reported in the section “Checking the Voter Register”. Interview questions on intent to go the polls are, of course, also helpful.
After the respondents had voted with the ballots we asked: “You voted earlier for the party you like the best today. Which of these two statements comes closest to your view of that party?” The respondents chose their answer from a card:
I like the party enough to go and vote for it on Election Day
The party will have to get along without my vote when election comes
By design we picked wordings that have a slightly emotional tone. In combination with the poststratification they proved accurate in simulating turnout.
The three question blocks -- best party, vote in previous election, and willingness to go to the polls on a coming Election Day -- allow us also to calculate a version of “normal vote” (Convers 1966). The data prior to the onset of an election campaign is sorted into the five categories A through E that are possible with the available questions:
|
Categori |
Voted for the party in the previous election |
Thinks the party is the best one today |
Likes the party enough to go and vote for it |
|
A |
Yes |
Yes |
Yes |
|
B |
Yes |
Yes |
No |
|
C |
No |
Yes |
Yes |
|
D |
No |
Yes |
No |
|
E |
Yes |
No |
— |
The simplest regression equation of a “normal vote” uses categories A and C. Data from April-June each election year between 1970 and 1982 renders this regression equation.
Normal outcome = 1.0770 x A + .4182 x C + 167.4 (thousands of votes)
We used this calculus after the election 1982 to tell which parties had made better than average campaigns and worse than average campaigns. (Indikator 1992:14). More complex regressions can use all categories and also the size of the memory shifts about the past voting.
Secret and Open Answers, Secret, that is, to the Interviewer
To study the functioning of the secret ballot in greater detail, during the spring of 1973, Sifo carried out a methodological experiment. Two equivalent samples of some 1,150 voters in the 1970 election were asked which party was the best, both openly by choosing a ballot-paper that they then showed to the interviewer and secretly, by placing a ballot-paper in an envelope and then in a box. The respondents were then asked, in a similar manner, to repeat how they had voted in 1970. The envelopes were sent to Sifo, unopened, with the questionnaire.
The results were compared, both poststratified by region and party support in the last election and in their unweighted form. The table below summarizes the results. All the figures are percentages. The figures in brackets are unweighted.
|
Experiment in March 1973 |
||||||
|
Party |
1970 election |
Reported voting in the 1970 election |
Best party today |
|||
|
Open ballot |
Secret ballot |
Open ballot |
Secret ballot |
|||
|
Basis: respondents who mentioned a party |
||||||
|
M1 |
11.5 |
(11.7) |
(11.9) |
12.0 (11.6) |
14.3 (14.4) |
|
|
Fp2 |
16.2 |
(14.1) |
(16.4) |
13.9 (12.1) |
10.2 (10.4) |
|
|
Cp3 |
19.9 |
(19.8) |
(17.9) |
26.7 (26.8) |
28.7 (27.0) |
|
|
Kds4 |
1.8 |
(1.6) |
(1.1) |
1.4 (1.4) |
1.5 (1.3) |
|
|
S5 |
45.3 |
(49.0) |
(49.1) |
41.7 (44.5) |
39.2 (41.8) |
|
|
Vpk6 |
4.8 |
(3.4) |
(3.4) |
3.9 (3.1) |
5.0 (4.4) |
|
|
Skp7 |
0.4 |
(0.4) |
(0.3) |
0.6 (0.5) |
1.1 (0.8) |
|
|
1 M = Moderate Party 2 Fp = Liberal Party 3 Cp = Center Party 4 Kds = Christian Democratic Party 5 S = Social Democratic Party (SDP) 6 Vpk = Left Party Communists 7 Skp = Swedish Communist Party |
||||||
|
Basis: all respondents |
||||||
|
No response concerning the best party, or no party-support data from those claiming to have voted |
|
( 8.1) |
(0.2) |
8.2 (11.9) |
4.8 (4.8) |
|
Source: Zetterberg & Busch (1976) p 6.
From the table, we can draw several conclusions:
1. More people answer the questions if the ballot is secret.
2. The open ballot yields result that better reproduces the previous election outcome than the secret ballot.
3. Fringe parties on the left-right continuum, such as the Left Party Communists and the Moderate Party, receive a lower share with the open ballot.
4. The socially most acceptable parties – the SDP, which was the party of government at the time of the experiment, and the Liberal Party, which enjoyed the strongest support in the press – are voted “the best party” by a higher proportion if the ballot is open.
We were, of course, aware that these conclusions are not necessarily valid in climates of opinion different from (“kinder” than) that prevailing in spring 1973. But the results of the secret ballot were consistently found as more correct. On the basis of these results, Sifo decided henceforth to use the secret ballot for its electoral polls with face-to-face interviews. It should be pointed out that the experiment does not show an unequivocal improvement in accurate perception of the 1970 election thanks to the secret ballot. For the Liberal Party, which showed a decline between the dates of the election and the experiment, the election result was underestimated in the open ballot and proved fairly correct in the secret one. For the Center Party, which advanced during the same period, the opposite is true. The secret and open ballot yielded, for the Social Democrats, the same estimate of electoral behavior in 1970: a major overestimation. The secret ballot brought clear improvements, but the problems of input data for poststratification by past party vote were by no means solved by the use of this method.
Deviation from Trend. Empirical Margin of Error
A sound indication of the trend of party sympathies –– what the election poll sets out to measure — is provided by a centred, sliding mean. We used a nine-month trend cycle without seasonal factors, with weights progressively lower the further away they are from the centred measure of the Henderson model (available in the X11-program mentioned earlier). An adequate trend figure for a given month can be obtained only six months later, when all the initial figures required for the sliding mean are available. The beginning of Sifo’s published percentage and the trend curve for the Social Democrats is shown here:
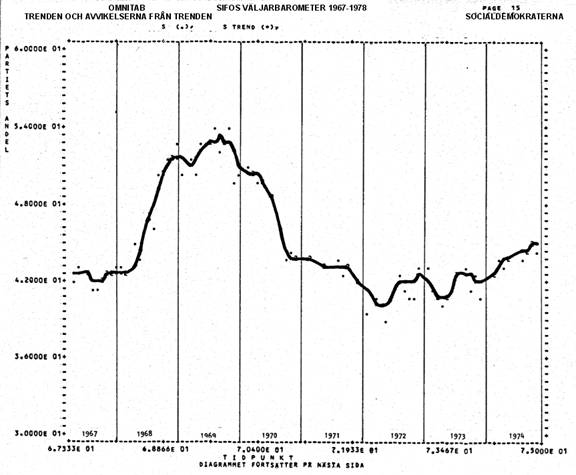
Source: Zetterberg (1979) Tables p 15.
Let us now compare the dots representing the published measurements with the trendline that represents the ambition of the electoral poll.
Mean error is the same as the standard deviation of results obtained from measurements from numerous repetitions with new random samples. The standard deviation of the difference between the election-poll figures and the trend figures is our equivalent of mean error. After 112 election polls, we drew the conclusion that one in 20 deviations from trend exceeds the following figures for the parties concerned:
1.11% for the Moderate Party
1.51% for the Liberal Party
1.60% for the Center Party
1.53% for the Social Democratic Party
0.90% for the Left Party Communists
We rounded these figures according to the rule of thumb for mass media and the public that is published with every election poll: “Attention should not focus on changes from a previously established trend or level that is less than 2 percent for parties with over 20 percent of the party sympathizers, or less than 1.5 percent for the other parties.” We consider it correct that the rule of thumb is somewhat stricter than the above figures would suggest, since the published figures are rounded to the nearest whole or half of a percentage point.
A mistake that occurs frequently in the mass media in interpreting a party standing series is to calculate deviations from the previous measurement instead of from a previously established trend or level.
Has Sophistication Been Gained or Lost?
Did Sifo’s investment in the methodology of electoral polls of the 1970s’ make a difference?
Of the various Swedish electoral polls, that of Statistics Sweden (SCB) has the highest level of ambition (showing what the election outcome would be), the most complicated poll design (with a built-in panel), the largest samples (counted in thousands of interviews except in September 1970) and, of course, the most massive resources (parliamentary grants for millions of kronor). Nonetheless, in its pre-election polls in the 1970s, Sifo achieved results closer to the election outcomes than SCB’s corresponding polls. Sifo published its figures before the elections and SCB after them. The figures and outcomes were as follows:
|
|
September 1970 |
September 1973 |
September 1976 |
||||||
|
SCB |
Sifo |
Election |
SCB |
Sifo |
Election |
SCB |
Sifo |
Election |
|
|
Moderate Party |
11.8 |
11.5 |
11.5 |
11.3 |
13.5 |
14.3 |
14.2 |
15.3 |
15.6 |
|
Liberal Party |
15.0 |
17.0 |
16.2 |
12.5 |
10.3 |
9.4 |
9.7 |
11.2 |
11.1 |
|
Center Party |
18.4 |
18.9 |
19.9 |
22.7 |
24.3 |
25.1 |
26.5 |
22.0 |
24.1 |
|
Social Democratic Party |
49.2 |
45.5 |
45.3 |
45.8 |
43.1 |
43.6 |
42.3 |
43.8 |
42.7 |
|
Left Party Communists |
3.1 |
3.7 |
4.8 |
4.9 |
5.1 |
5.3 |
5.1 |
5.1 |
4.8 |
|
Mean deviation per party |
1.72% |
0.62% |
|
2.2% |
0.68% |
|
1.18% |
0.78% |
|
|
Largest deviation |
3.9%(s) |
1.1% (vpk) |
|
3.1% (fp) |
0.9%(fp) |
|
2.4%(c) |
2.1%(c) |
|
|
(No. of interviews) |
(1,176) |
(1,398) |
|
(2,608) |
(1,140) |
|
(2,606) |
(1,013) |
|
Source: Zetterberg & Busch 1979, p 12-13
It is our belief that the difference is due to the several methodological advances mentioned above but mainly to Sifo’s more critical and sophisticated approach to the use of information on party support in the last election. This has more than offset SCB’s superior resources in other respects.
Five decades of election polling by Sifo is summarized in this table.
|
|
Mean deviation for the parties in parliament (average of elections) |
Largest deviation (average of elections) |
|
The 1950s (2 elections) |
1.9% |
4.1% |
|
The 1960s (5 elections) |
1.5% |
2.9% |
|
The 1970s (4 elections) |
0.6% |
1.3% |
|
The 1980s (3 elections) |
1.7% |
3.7% |
|
The 1990s (3 elections) |
0.8% |
1.7% |
Source: for 1950s – 1970s, Busch & Zetterberg (1982) p 1 and for 1980s-1990s Toivo Sjörén, Sifo Research and Consulting
The gilded age is Sifos pre-election studies in the 1970s. An error in constructing the Swedish constitution had left parliament with an even number of members. In our pre-election survey correctly forecasted a hung parliament, a public relation bonus that made the poll look better than it design allowed.
We have seen the sophistication that was added when compared to earlier decades. What happened later? Was sophistication lost?
Telephone Interviewing
In the 1980s Sifo switched to telephone interviewing in the regular polls of party preferences.
On the positive side you gained speed. Interviewing from a central location facilitated and improved the supervision of interviewers. It was possible to retain the advantages separating the survey population into a quick-access stratum, and a hard-to-contact stratum
Instead of sampling from the population register respondents were now located by random digit dialling. The sampling quality declined somewhat since households without phone (less than 10 per cent in Sweden in the 1980s) were excluded. Nonresponse becomes higher in small households than in large ones where the chance was greater that some would answer the phone. The fact that phones were connected to households of different sizes rather than to one specific individual and the fact that some households have several phones (including one in a weekend house) made the conversion weights to turn the sample into a sample of eligible voters very complex. Some individuals received very low weights, some very high. This disadvantage could in part be compensated for by larger samples with smaller budgets. Nevertheless the accuracy of the Sifo polls of the 1970s could not be fully maintained in the following decades.
Questioning
With telephone interviewing you no longer could simulate an election in the interview situation and use secrets ballots in the weekly omnibus survey. Nor could you use response cards for the turnout question. The shares of Don’t Know and No Answer increased somewhat with interviewing over the phone compared to face-to-face.
Integrity Legislation Restricts Checking
Legislation protecting personal integrity prohibited anyone, including pollsters, from maintaining computer files with names, addresses, and party preferences and past voting. While it still was possible to manually check the voting register to ascertain if the sample to be interviewed had voted in the last election, it was a crime in Swedish law to enter this information into a computer file with identifiable respondents.
Company Policy
Zetterberg left Sifo in 1986 and Busch in 1988. In the 1990s the panel design for the final pre-election poll was dropped. The calculation of trend values ceased. The use of empirically determined error terms thus disappeared. Sifo also reintroduced uncritical poststratification by past voting, taking full advantage of the power of the method to reduce variation. The outcome was virtually as good as the gilded age of the 1970s. Luckily there was no political development in the 1990s that caused large memory shifts as in 1968. In the coming election 2002, however, the memory shifts seem larger. This year uncritical poststratification can be practiced only at the peril of the user.
References:
Abelson, Herbert I 1959. Persuation, Springer, New York.
Bradburn, Norman M, S. Sudman & Associates 1979. Improving Interview Method and Questionnaire Design: Response Effects to Threatening Questions in Survey Research,: Jossey-Bass, San Fransisco.
Busch, Karin & Hans L Zetterberg 1982. ”Svenska förvalsundersökningar 1955-1982”, Sifo/Safo skriftserie, No. 3 p 1-9. also at www.zetterberg.org/Papers/ppr1982c.htm
Cochran, W 1953. Sampling Techniques, Wiley, New York.
Converse, Philip E 1966. "The Concept of a Normal Vote", in Angus Cambell et al (eds), Elections and the Political Order, Wiley, New York, pp 9-39.
Dalenius, Tore 1957. Sampling in Sweden: Contributions to the method and theories of survey practice, Almquist & Wiksell, Stockholm.
Demming, W 1950. Some Theory of Sampling, Wiley, New York.
Hansen, M H, W Hurwitz, & W Madow 1953. Sample Survey Method and Theory, Wiley, New York.
Håstad, Elis et al. 1950. “Gallup” och den svenska väljarkåren. Uppsala, Almquist och Wiksells.
Indikator 1982.”Valens normalutfall” in Sifos Nyhetsbrev Indikator, no 14. September 21, pp 1-4 also on this web.
Lazarsfeld, Paul F, Bernard Berelson & Hazel Gaudet 1948. The People's Choice; How the voter makes up his mind in a presidential campaign, Columbia University Press,. New York.
Kish, Leslie 1967. Survey Sampling, John Wiley & Sons, New York.
Noelle-Neumann, Elisabeth 1980. Die Schweigespirale: Öffentliche Meinung – unsere soziale Haut, Piper, München.
Zetterberg, Hans L 1957. "Compliant Actions", Acta Sociologica, vol 2, pp 179-202.
–“– 1967 "System Veckobuss", Sociologisk Forskning, vol 4, pp 139-151
–“– 1979. Sifos väljarbarometer och dess avvikelser 1967-1978, Sifo, Vällingby, also in Swedish and English on this web.
–“– & Karin Busch 1976. "Användning av information om parti i senaste val i mellanvalsperiodernas partisympatiundersökningar", Sifo/Safo skriftserie, No. 1, 1976, pp 1-13, also in Swedish and English on this web.
![]()
Appendix A. Questionnaire for Sifo´s Political Analysis
|
Are you Swedish citizen? Yes No
C.
TO ALL. PLEASE READ: You will now take part in something similar to an election
for parliament and leave your vote in this envelope. SHOW BROWN ENVELOPE. Do not
tell me how you vote or which party you favour. Only put your ballot in the
envelope. Everything is totally anonymous. I will never know how you voted. Only
personnel at the Sifo´s head office may open the envelope and find out how you
voted.
Here are eight cards with the names of the political parties. Please choose the
party you like the best today. TEAR OFF THE OUTER ROW OF BALLOTS AN HAND OVER TO
RESPONDENT. ALL BALLOTS MUST BE SEPARATED SO THAT YOU HAND OVER EIGHT DIFFERENT
PIECES OF PAPER. IT IS NOT ALLOWED TO HAND THEM OVER WITHOUT SEPARATING THE
BALLOTS.
Here is an envelope. HAND RESPONDENT THE BLANK ENVELOPE!
Please put your ballot into this envelope and keep the rest so that I cannot
figure out how you answered. Do not tell me how you plan to vote. Please, seal
the envelope and put it into the larger envelope. PERSONS WHO SAY THAT THEY
CANNOT OR DO NOT WANT TO ANSWER THE QUESTION ON BEST PARTY MAY LEAVE AN EMPTY
ENVELOPE.
D.
TO ALL SWEDISH CITIZENS BORN 1958 OR EARLIER ACCORDING TO THE COVER:
WHEN THE FIRST VOTING IS READY, TEAR OFF THE SECOND ROW WITH BALLOTS “ELECTION
1976” AND THE CARD “I DID NOT VOTE”. SEPARATE BALLOTS.
Now I would like you to think back on the latest election for parliament, which
took place in 1976. Please repeat and vote exactly as you did then. Please use
these ballots and this envelope.
HAND OVER BALLOTS AND ENVELOPE MARKED “ELECTION 1976”.
Do not tell me how you voted. Only put your ballot in this envelope. If you did not have the opportunity to vote in 1976, you can use the ballot with the text “I did not vote in the parliamentary election in 1976” and put it in the envelope instead. Do not tell me if you voted or not.
E. TO ALL: You voted earlier for the party you like the best today. Which of these two statements comes closest to your view of that party? SHOW CARD E AND READ ALOUD THE TWO RESPONSE ALTERNATIVES.
Do not tell me which party you prefer.
1. I like
the party enough to go and vote for it on Election Day
2. The party will have to get along without my vote when election comes
3. Do not know
![]()
Appendix B. Cover Pages to Questionnaire
![]()
![]()
![]()
Appendix C. Party Preference Survey from Statistics Sweden
The Party Preference Survey
The questions were included in the Party Preference Survey (Partisympatiundersokningen -PSU) conducted by Statistics Sweden (SCB) twice a year, in May and November I since 1972 (Sollander, S. (1979): The Swedish Party Preference Surveys. Survey Statistician No.. 1, February 1979). PSU is a telephone interview survey based on a simple random sample of about 9000 citizens of voting age with no upper age limit, thus the percentages presented are estimates and not precise. The degree of uncertainty for an estimate is depending on the percentage estimated and on the number of respondents. The interviews are conducted over a period of three weeks. Non-response averages about 25 per cent ("not at home" about 10 per cent (including unlisted telephone numbers), those indisposed, etc. about 3 per cent and refusals about 13 per cent).
"If there were an election to the Riksdag today". May 2002
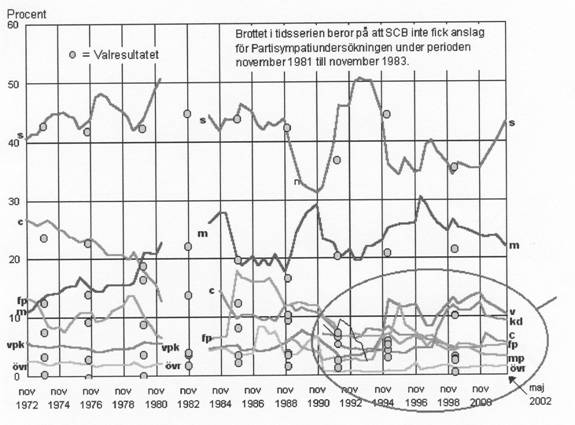
S = Social Democrats
c = Centre Party
fp = Liberal Party
m = Moderate Party
kd = Christian Democrats
v = Left Party
mp = Green Party
ovr= Other
Source: SCB 2002-06-14