SIFO/SAFO skriftserie Nr 1 1970
Svenska Institutet for Opinionsundersökningar, SIFO
By Hans L. Zetterberg and Karin Busch
A remarkable stability of the party structure is one of the more noteworthy traits of the western democracies. A Swedish voter who in the 1920's fell asleep and woke up today would without difficulty recognize today's parties as the same as the ones operating half a century ago; the landscape of parties from the 1920's has not changed, although some party names would be new. By and large, the same is true for the parties on the continent: after the nazism and fascism and world war, the parties of the 1920's re-appear and gather the political ideas and feelings of the 1950's, 1960's and 1970's.
The changes of the social structure are slow and their political consequences are of little interest to the politician concerned about the next election. But, if we measure in decades instead of election campaigns, the structural changes become significant. For an overview of the changing bases of Swedish politics we shall compare more than 30.000 interviews from 1967-1969 with more than 23.000 interviews collected in 1946-1948. The older sample is a quota sample drawn by The Swedish Gallup Institute; the newer sample is a probability sample from The Swedish Institute of Public Opinion Research (SIFO).
At the time of the advent of Swedish democracy, there were large parts of the social structure that were not cultivated by any party. This may be illustrated by the fact that the turnout in election was low: in the 1910's between 47% and 70% of the enfranchised voted; in the 1920's, when women had obtained the right to vote, between 38% and 67% voted. In 1968, the turnout was 89%. About 94-96% now declare a party sympathy when pollsters ask their questions. There is no longer any important part of the social structure where political parties lack roots. It is this shortage of political no-man's-land that has made it difficult, almost impossible, for new parties to succeed, even if they happen to represent a large opinion. For example, about 2.3 million Swedes supported religious instruction in schools by signing a petition to the government. When a new party, The Christian Union, was later formed to push for this and similar causes it received less than 100.000 votes. Likewise, in 1968, strong sentiment among the public for a change in the organization of the non-socialist opposition resulted in insignificant voter strength for a new party, The Progressive Party, whose main platform was the merging of the non-socialist parties.
In the last few decades, Sweden has become more urbanized and more middle-class. The traditional party of the rural areas (Agrarian, Center) and the traditional party of the working-class (Social Democrats) have adjusted well to these changes in the social structure. This applies especially to the Center Party.
|
|
Total electorate |
Agrarian Party |
Center Party |
|
|
1946 |
1967-69 |
|||
|
Metropolitan areas, incl suburbs Other cities Rural areas |
17 21 62 |
27 34 39 |
0.5 2 97 |
12 24 64 |
|
Number of interviews |
13.991 |
37.538 |
1.878 |
6.156 |
The advance of the Center Party into the cities is actually made at a faster pace than the immigration to the cities. A change of name in 1957, when the Agrarian Party started to call itself the Center Party, was a necessary part of this adjustment to an urbanized electorate.
In 1946 the Social Democrats already had a representation among white-collar workers amounting to 26% of the party, and this proportion has since increased so that 37% of the party are now outside the blue-collar working-class.
|
Total electorate |
Social Democrats |
|||
|
1946-48 |
1967-69 |
1946-48 |
1967-69 |
|
|
Upper and middle-class Working-class |
46 54 |
58 42 |
26 74 |
37 63 |
|
Number of interviews |
23.400 |
37.538 |
12.100 |
17.100 |
The breakthrough of the Social Democrats into the middle-class has kept pace with the structural decline in working-class occupations, and the expansion of the white-collar ranks. The so-called "pensions elections" at the end of the 1950's successfully consolidated the claim of Social Democracy to speak for all employees, both blue-collar and white-collar. The new middle-class territory was taken without loss among the traditional support in the working-class. In 1948, 71% of the working-class voted for the Social Democrats and in 1967-69, 68% did the same, an insignificant change.*)
![]()
*)
In 1948, it looked as if the Liberal Party would break into the blue-collar class when it received 15% of the votes of the working-class homes. However, in 1967-69, the Liberal Party received only 9% of the working-class votes. The Agrarian Party had 5% of the votes of the working-class in 1946-48, but its successor, the Center Party, received 11% in the 1967-69 interviews. At present the supporters of the Center Party have the largest surface of contact with the Social Democrats and the balance of strength between these two parties decides the composition of the Government.![]()
The present anchorage of the politics to the social structure can be illustrated by two kinds of tabulations of occupations and parties. The first table shows the distribution of the party sympathies within different occupational categories. The second table shows the distribution of different occupations within different parties.
|
Men entitled to vote who are: |
Party at time of interview 1967-69 (N.B. percentages are counted horizontally) |
Average of total yearly household income |
|||||
|
Cons. |
Lib. |
Cent. |
Chr.U. |
Soc. |
Com. |
||
|
Owner-farmers |
21.6% |
5.3 |
67.8 |
1.4 |
3.8 |
0.0 |
21.670:- |
|
Business owners, except farmers |
16.6% |
22.2 |
23.0 |
1.1 |
29.7 |
7.3 |
32.750:- |
|
Upper-level white-collar employees |
40.8% |
34.8 |
7.1 |
0.5 |
12.3 |
4.5 |
46.740:- |
|
Middle-level white-collar employees |
20.3% |
27.6 |
24.9 |
1.2 |
22.2 |
3.8 |
34.600:- |
|
Lower-level white-collar employees |
13.2% |
20.7 |
16.2 |
0.7 |
45.4 |
3.8 |
33.940:- |
|
Skilled blue-collar workers |
2.5% |
11.0 |
12.5 |
0.9 |
67.0 |
6.1 |
33.080:- |
|
Semi-skilled blue-collar workers |
3.9% |
8.7 |
14.7 |
1.1 |
64.2 |
7.3 |
30.670:- |
|
Unskilled workers in industrial or urban jobs |
1.9% |
7.9 |
13.0 |
1.5 |
67.3 |
8.3 |
27.700:- |
|
Manual workers in farming and forestry |
|
|
|
|
|
|
|
|
(Figures within parenthesis show the number of men entitled to vote) |
|||||||
From this informative table we may conclude:
| Among farmers, a total of 94% are non-Socialists; about 70% vote for the Center Party. Of younger, farmers — they are fewer and somewhat more well-to-do than their parents — 22% are Conservatives, while among the older, 14% vote Conservative. The farmers have a lower total household income than the industrial workers; even manual workers in farming and forestry have higher cash incomes than owner-farmers. The alienation from the mainstream of economic development prevailing among the small farmers may find bitter and surprising political expressions; however outright poujadism is rare in Sweden. | |
| Of business owners, 71% are non-Socialists: 26% vote for the Liberal Party, 23% for the Conservatives, and 21% for the Center Party. The image of the business proprietors as rich bourgeois capitalist is misleading. True, among owners within trade and industry who have at least 45.000 Crs in yearly total household income, 83% are non-Socialists (39% Conservatives, 29% Liberals, 14% Centerites and 1% Christian Union). But, on the whole, the statistics are dominated by the petty bourgeoisie with low incomes, e.g., the owners of newspaper stands, tobacco shops, grocery stores, travel agencies, gas stations, trucking companies with one truck, and by hairdressers, plumbers or house-painters with their own business in which they do almost everything themselves, photographers, florists, owners of small workshops, manufacturers of handicrafts, etc. This heterogeneous group of independent entrepreneurs have average incomes that are not higher than the incomes of skilled workers or white-collar employees in the lowest ranks. The Social Democrats actually have the same share of these petty capitalists as has the Conservative Party; among the younger even much more than the Conservatives. The latter represents 26% of the older but only 17% of the younger enterprisers. Large-scale industrial and business enterprises — mounted by the Government, the co-op movement, or by big business — have put strains on small businesses and spread dissatisfaction among their ranks. Actually, the Communists are the party of 7% of younger entrepreneurs. But, before this figure is interpreted as ultimate evidence of the desperation among the small Swedish entrepreneurs, we should remember that free professionals such as authors and artists who more seldom have bourgeoisie sympathies, are also included in the category "business owners, except farmers" in our table. | |
| The Conservatives have their strongest roots in the executive suites and among the higher civil servants. 57% of the older and 41% of the younger vote Conservative. The Liberals are dominant among the middle-level white-collar employees: 61% of the older and 53% of the younger. The Social Democrats dominate among the lowest white-collar groups: 52% of the older and 45% of the younger. The Social Democratic break-through into the white-collar ranks is also noticed in the intermediate level where 22% of the younger, compared with 15% of the older, vote for this party. | |
| The entire blue-collar spectrum is Social Democrat — 64% to 72% depending on category. There is only one exception: younger laborers within farming and forestry are more often Centerites than Social Democrats. |
The political outlook of the white-collar employees depends to a considerable extent in what field they are employed.
|
|
Male white-collar employees in: |
||
|
Farming and |
Private owned business |
State owned and municipal business |
|
|
Conservative Party |
17 |
21 |
12 |
|
Number of interviews |
221 |
3177 |
792 |
On the whole, white-collar employees politically follow the owners of the enterprises in which they work. When the owners are Conservatives or Liberals — which mostly is the case within the private business sector — the employees become Conservatives or Liberals. If owners are mostly Centerites — as in farming and forestry — their employees support the same party. When the owners are Social Democrats — which mostly is perceived to be the case within the Government-owned business sector after nearly four decades of Socialist rule — the white-collar employees become Social Democrats. The party that argues for an increase of the public sector obtains most votes from there. By expanding the Government's role as owner of enterprises, the Swedish Social Democrats have increased their followers among administrators of these enterprises.
In the previous tables we saw how the occupational classes are divided into parties. Let us now turn the problem and study how the parties are combined according to occupation. We then get the following table:
|
Men entitled to vote who are: |
Party at time of interview 1967-69 |
|||||
|
Cons. |
Lib. |
Cent. |
Chr.U. |
Soc. |
Com. |
|
|
Owner-farmers |
8,3 |
3,1 |
23,9 |
10,9 |
1,1 |
0,9 |
|
White-collar employees |
|
|
|
|
|
|
|
Skilled blue-collar workers |
1,3 |
5,0 |
4,2 |
6,6 |
15,3 |
13,3 |
|
Number of interviews |
2.399 |
2.717 |
3.752 |
211 |
6.885 |
928 |
The table indicates that many popular ideas about the social bases of the parties are incorrect or, at best, half-truths.
| The Conservative Party does not mainly consist of industrialists and businessmen. They represent only 12% of the party. The main constituent group of the party is employees of higher or middle level; they represent 58% of the party. | |
| Neither is the Liberal Party dominated by businessmen — they represent 12%. White-collar employees in medium or lower levels represent 54% of the party. | |
| The farmers are not the majority of the Center Party. (The popular image to the contrary lingers on because many party functionaries and members of Parliament from this party come from farming and forestry). 24% of the Centerites are farm-owners. The party consists of 49% white-collar employees and 20% labourers. Thus, there are almost as many laborers as farmers. | |
| The Social Democratic Party is much more than a labor party. 33% of its gainfully employed males have middle-class occupations. If we also count the women in labor force and classify housewives according to their husbands’ occupations, the figure — as shown earlier — becomes 37%. Only 1% of the Social Democrats are farmers, and it is difficult for the farming interests to make their voice heard within the party councils. |
The class concept we use in social research separates occupational groups controlling larger and smaller resources, having responsibility for more and fewer employees, and requiring longer or shorter educational preparation. Differences in behavior, values, attitudes, knowledge, habits, life chances, etc. have been repeatedly documented between different social classes.
Different classes make claims on each other and on the old and new resources of the society. The political parties negotiate these claims, and attempt to formulate programs with special appeal to those classes within which they have or want to obtain votes. In this way they plead the causes of different classes of society, and it has been said that party politics is an organized, bloodless class war. In reality, as we have seen, all Swedish parties have sympathizers within all classes of society — albeit to rather different extents. The parties differ not only regarding the votes they receive from high and low class positions within society but also regarding the proportions of votes from central and peripheral parts of the social structure.
The centrality dimension divides people in the social structure according to their contacts. People with many contacts and information channels are central, those with few are peripheral. News and novelties usually spread from the central to the peripheral parts of the society. Within Swedish politics this dimension is interesting mainly because the central parts are usually favoured by the present economic developments and the peripheral parts are usually disfavoured, and this is true whether or not one is placed high or low on the class scale.
An interesting diagram is obtained when the political parties are positioned, so that it is possible to read their scores both in terms of centrality and class:
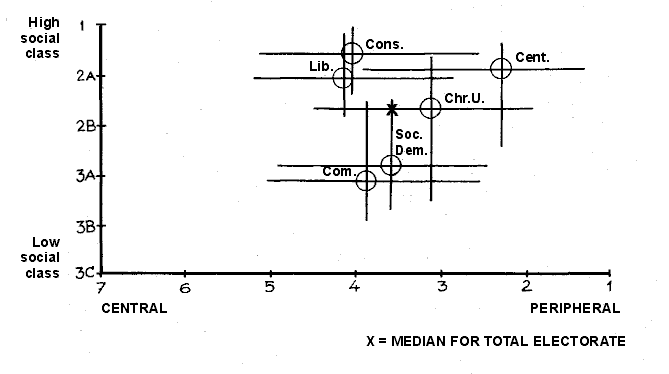
We notice that the Swedish parties form three clusters: Conservatives and Liberals are the higher and more centrally placed, covering a relatively small part of the range of classes. Social Democrats and Communists are the lower placed parties; and the peripherally placed parties are the Center Party and the Christian Union. The Conservative and the Liberal Parties are very similar in terms of supporters. The Social Democrats reached the same degree of centrality, but cover a wider class-range with full representation of the lower-classes. The Center Party is the collection point for the peripherally positioned.
At the same time as the Social Democrats became the party of the central middle-class, the Agrarians remained the party of the periphery. The latter party gathered the vaguely expressed desires from the peripheries to join the more advantageous central positions by changing its name to the Center Party. The future of Swedish politics lies as much in the battle between the central segments of society and peripheral ones as between the higher classes and the lower classes. A Government- supporting majority can be found either by a coalition of the high and central or by a coalition of the low and peripheral. The Social Democrats came into power in the 1930's by representing a coalition of the low and peripheral but in their long reign since then they have moved to represent a larger share of the high and central. At present, the party is engaged in a massive effort on behalf of low-income groups, but it is too early to tell whether this effort will move its social base back into the territory of the low and peripheral.
* * * * * * *
This article appeared in Swedish in Indikator of October 1969.
Indikator is the newsletter of The Swedish Institute of Public Opinion Research (SIFO), Stockholm.
Reprinted by permission.